 |
| click on this to see it full-size. It is an A0 poster template. Here's my svg source. |
Finished my draft poster for 2.671 Measurement and Instrumentation (required communications course for MechE undergrads). Basically, we are given free reign to design and collect data from our own experiment, and we have to present in a Poster Session at the end of the semester (I present next Thursday).
Well, I'm abysmally behind in this class but catching up, and I made this fluffy poster Thursday night - Friday morning. (Fluffy, as in not much content and no math). What follows is an overview of the tools I used, and at the end my poster / my Inkscape svg source file.
My Inkscape file is based on the wonderful Inkscape template I found online. I found it aesthetically pleasing compared to the default 2.671 template. (If you search for "2.671" on Google you'll find some posters other classmates made using the default template).
Actually here's Eli's poster, which shows the default powerpoint template scheme if not the exact template:
 |
| elimarcdavis.blogspot.com/p/go-forth-and-measure.html |
MedHelp Visualization
My sleep patterns on MedHelp: medhelp.org/user_trackers/show/1150087 (all data off by one day, e.g. medhelp 5/4 = real life 5/3)Data was manually entered. See poster below for what weeks correspond to what levels of caffeine.
 |
| this is the MedHelp user interface. GUI is a bit confusing, I like how Fitbit below has a "previous or same day" input option, maybe would have avoided putting all my data in off by one day. |
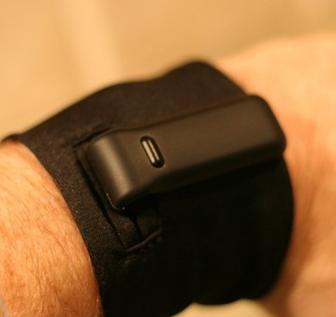
Fitbit (wireless 3-axis accelerometer)
My sleep tracker on Fitbit: http://www.fitbit.com/user/22J93R/sleepWhat a fitbit looks like:
 |
| www.healthyobsessions.net/wp-content/uploads/2010/03/fitbit-band.jpg |
 |
| Data input user interface |
 |
| data view - get rough idea of accelerometer data (red = active, blue = not moving / probably asleep). |
Google Docs
A preview of my preliminary spreadsheet of sleep data and caffeine intake |
| left, caffeine input. right, sleep start and stop time tracking (and color-coded time elapsed for my own curiosity) |
Scientific Poster in Inkscape
Finally, I made a poster in the wonderful open-source free program Inkscape. More importantly, I used a template I found online.
- Inkscape svg+scientific poster (has source!) from 2009.
- for ref., he had some complaints (I think TeX built into inkscape now, so outdated complaints) and wanted to switch to Scribus
Here's a preview of my draft poster (and a perhaps helpful flowchart of things): entirely based on the example poster I found online. Thanks a bunch to airlich.
|
| click on this to see it full-size. It is an A0 poster template. |
Here's my svg source.
!!!!!!!!!!!!!!!!=====
WIP screenshots
And a WIP picture of what the template looks like inside Inkscape: |
| around 9am Friday morning |
 |
| An hour later, inside Inkscape @ completion of draft poster |
=====
appendix
for reference, my research braindump from earlier in the semester:http://nouyang.blogspot.com/2012/04/tools-for-scientific-posters-braindump.html
raw fitbit data
And then some current research on getting "raw data from fitbit"http://blog.brianhouse.net/post/6877602920/an-activity-heatmap-from-fitbit-data
However, prior to the release of the Fitbit API, the developer Eric Blue published a hack in perl that scrapes data from your Fitbit profile page — turns out that the Flash charts they display are powered by an XML feed with significantly more resolution than what is offered via the API. Based on this discovery, I wrote a python script that pulls the granular data.http://ask.metafilter.com/148577/How-fast-am-I-moving-now
http://genehack.org/2010/07/fitbit_feedback/
http://groups.google.com/group/fitbit-api/browse_thread/thread/da58825fa0d6cf4a?pli=1
https://github.com/wadey/python-fitbit
http://workshop.evolutionzone.com/2012/04/07/fitbit-shame-on-you/
http://www.facebook.com/note.php?note_id=197156750312861
https://wiki.fitbit.com/display/API/Fitbit+API
Yea, the Fitbit premium export of data just looks like:
| Sleep | ||||
| Date | Minutes Asleep | Minutes Awake | Number of Awakenings | Time in Bed |
| ######## | 0 | 0 | 0 | 0 |
| ######## | 0 | 0 | 0 | 0 |
| 5/1/2012 | 0 | 0 | 0 | 0 |
| 5/2/2012 | 0 | 0 | 0 | 0 |
| 5/3/2012 | 136 | 22 | 16 | 190 |
| 5/4/2012 | 123 | 32 | 16 | 270 |
| 5/5/2012 | 0 | 0 | 0 | 0 |
which isn't terribly useful to me. So yay more chances to practice coding skills. =^__^=
===
This is post is continued at Inkscape 42''x36'' Scientific Poster w/ SVG source (Caffeine's Impact on Sleep)
No comments:
Post a Comment